
Key Points
- Make sure to visualize both the internal and external impacts.
- There are a wide range of methods to visualize the impact of website change.
Teams frequently agree to digital strategies without understanding the impact of those agreements. The downside: these strategies often cannot be implemented or will not meet business goals.
Qualitative illustrations of impact to confirm buy-in
In general everyone has fairly highly honed skills for visualizing (and receiving the message of) the positive impact of changes, so here I will concentrate on visualizing the costs of making big changes as well as the disadvantages of not taking action. This isn’t about quantitative costs in the ROI sense, but costs in a more qualitative perspective to help determine whether you can even achieve your vision at all (for instance, if to achieve better flow of content across departments requires less page-level control, then teams either need to buy into that decrease in control or not). All the ROI calculations in the world won’t matter if you can’t implement it.
Part of the problem is simple wishful thinking, but also I think as an industry we are poor at visualizing the cost impact of our strategy decisions. In this brief article I hope to demonstrate some techniques to make these impacts more concrete. In addition to giving techniques to illustrating the internal and external impacts of possible website changes, hopefully this article will also help to highlight some of the types of qualitative costs that are not immediately obvious as well.
In a sophisticated digital strategy development, the team (and any external consultants) drive toward a strategy that is implementable in the first place (rather than developing a strategy, demonstrating that it is unimplementable, and then redeveloping the strategy). So ideally these approaches are toward creating a good strategy in the first place. Also, consider making your strategy as flexible as possible, for example creating vision on a scale.
Internal impacts
We have all seen them: digital strategies that don’t have a prayer of ever being implemented. I frequently arrive at organizations and can quickly tell that the strategy is not implementable. Often, this is not obvious to the internal team, and at that point they may be so invested in the strategy that they may be unwilling to see the issue. (so try to develop implementable, or at least prioritized, strategies).
We'll look at three ways you can make internal impacts concrete:
Effort needed for change
Content production impacts
Ownership and control impacts
Effort needed for change
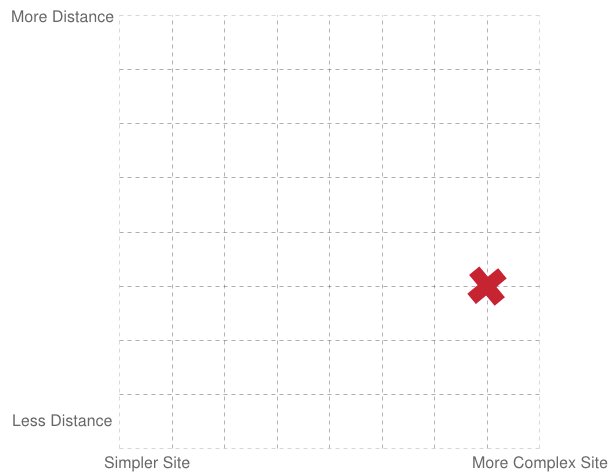
Like it or not, your site is the way it is now. You want to get it somewhere else. So there is a distance you are traveling (point A to point B), and there’s a weight of the stuff (for instance, the amount of content) that your moving from point A to point B. In other words, there’s an effort. Everyone needs to understand that effort.
One way to visualize the effort needed is to graph the distance and weight (or, more usefully, the complexity) such as this:
But you usually need to get to a deeper level of specificity. If there is any migration work, you can analyze the effort using six steps of content handling during a migration to generate an estimate of the manual migration effort like this example (similar techniques can be used for international rollouts of many websites):
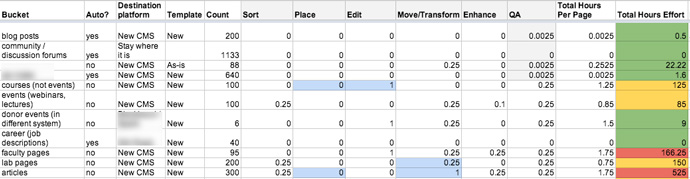
Note that when you are illustrating the effort you aren’t just providing the “answer” of what the estimate it, but also illustrating the process and also helping to break down the problem for constructive discussions (rather than just a “that’s too much effort” response). So regardless of the exact changes that you need to make to get to where you want to go, they should be broken down into high level steps (not a Gantt chart) and patterns (in the example above as “buckets”) to drive effective discussion and to ensure people really understand the impacts.
Content production impacts
Perhaps the more important changes are those that will forever change the way people work. Often there is a tradeoff that is not discussed: between doing things “right” at the beginning or increasing training costs, grumbling, and lack of quality forever.
For instance, take the common impulse to distribute content entry more broadly. In this case, you really have three options: 1) change systems and processes to better service a more distributed pool of content publishers (who are probably also going to enter content less frequently than a more centralized or dedicated team), 2) don’t change the systems and processes and have a big spike in publisher complaints and probable reduction in quality or frequency of publishing (and probably complaints about the technology, when the system just wasn’t developed with this use case in need), or 3) don’t distribute content entry more broadly. You’re going to pay somewhere, and it’s better to just make the decision up front, rather than being surprised about something that should not be a surprise. One way to illustrate content publishing processes are to compare the ideal with the current publishing process like the following:
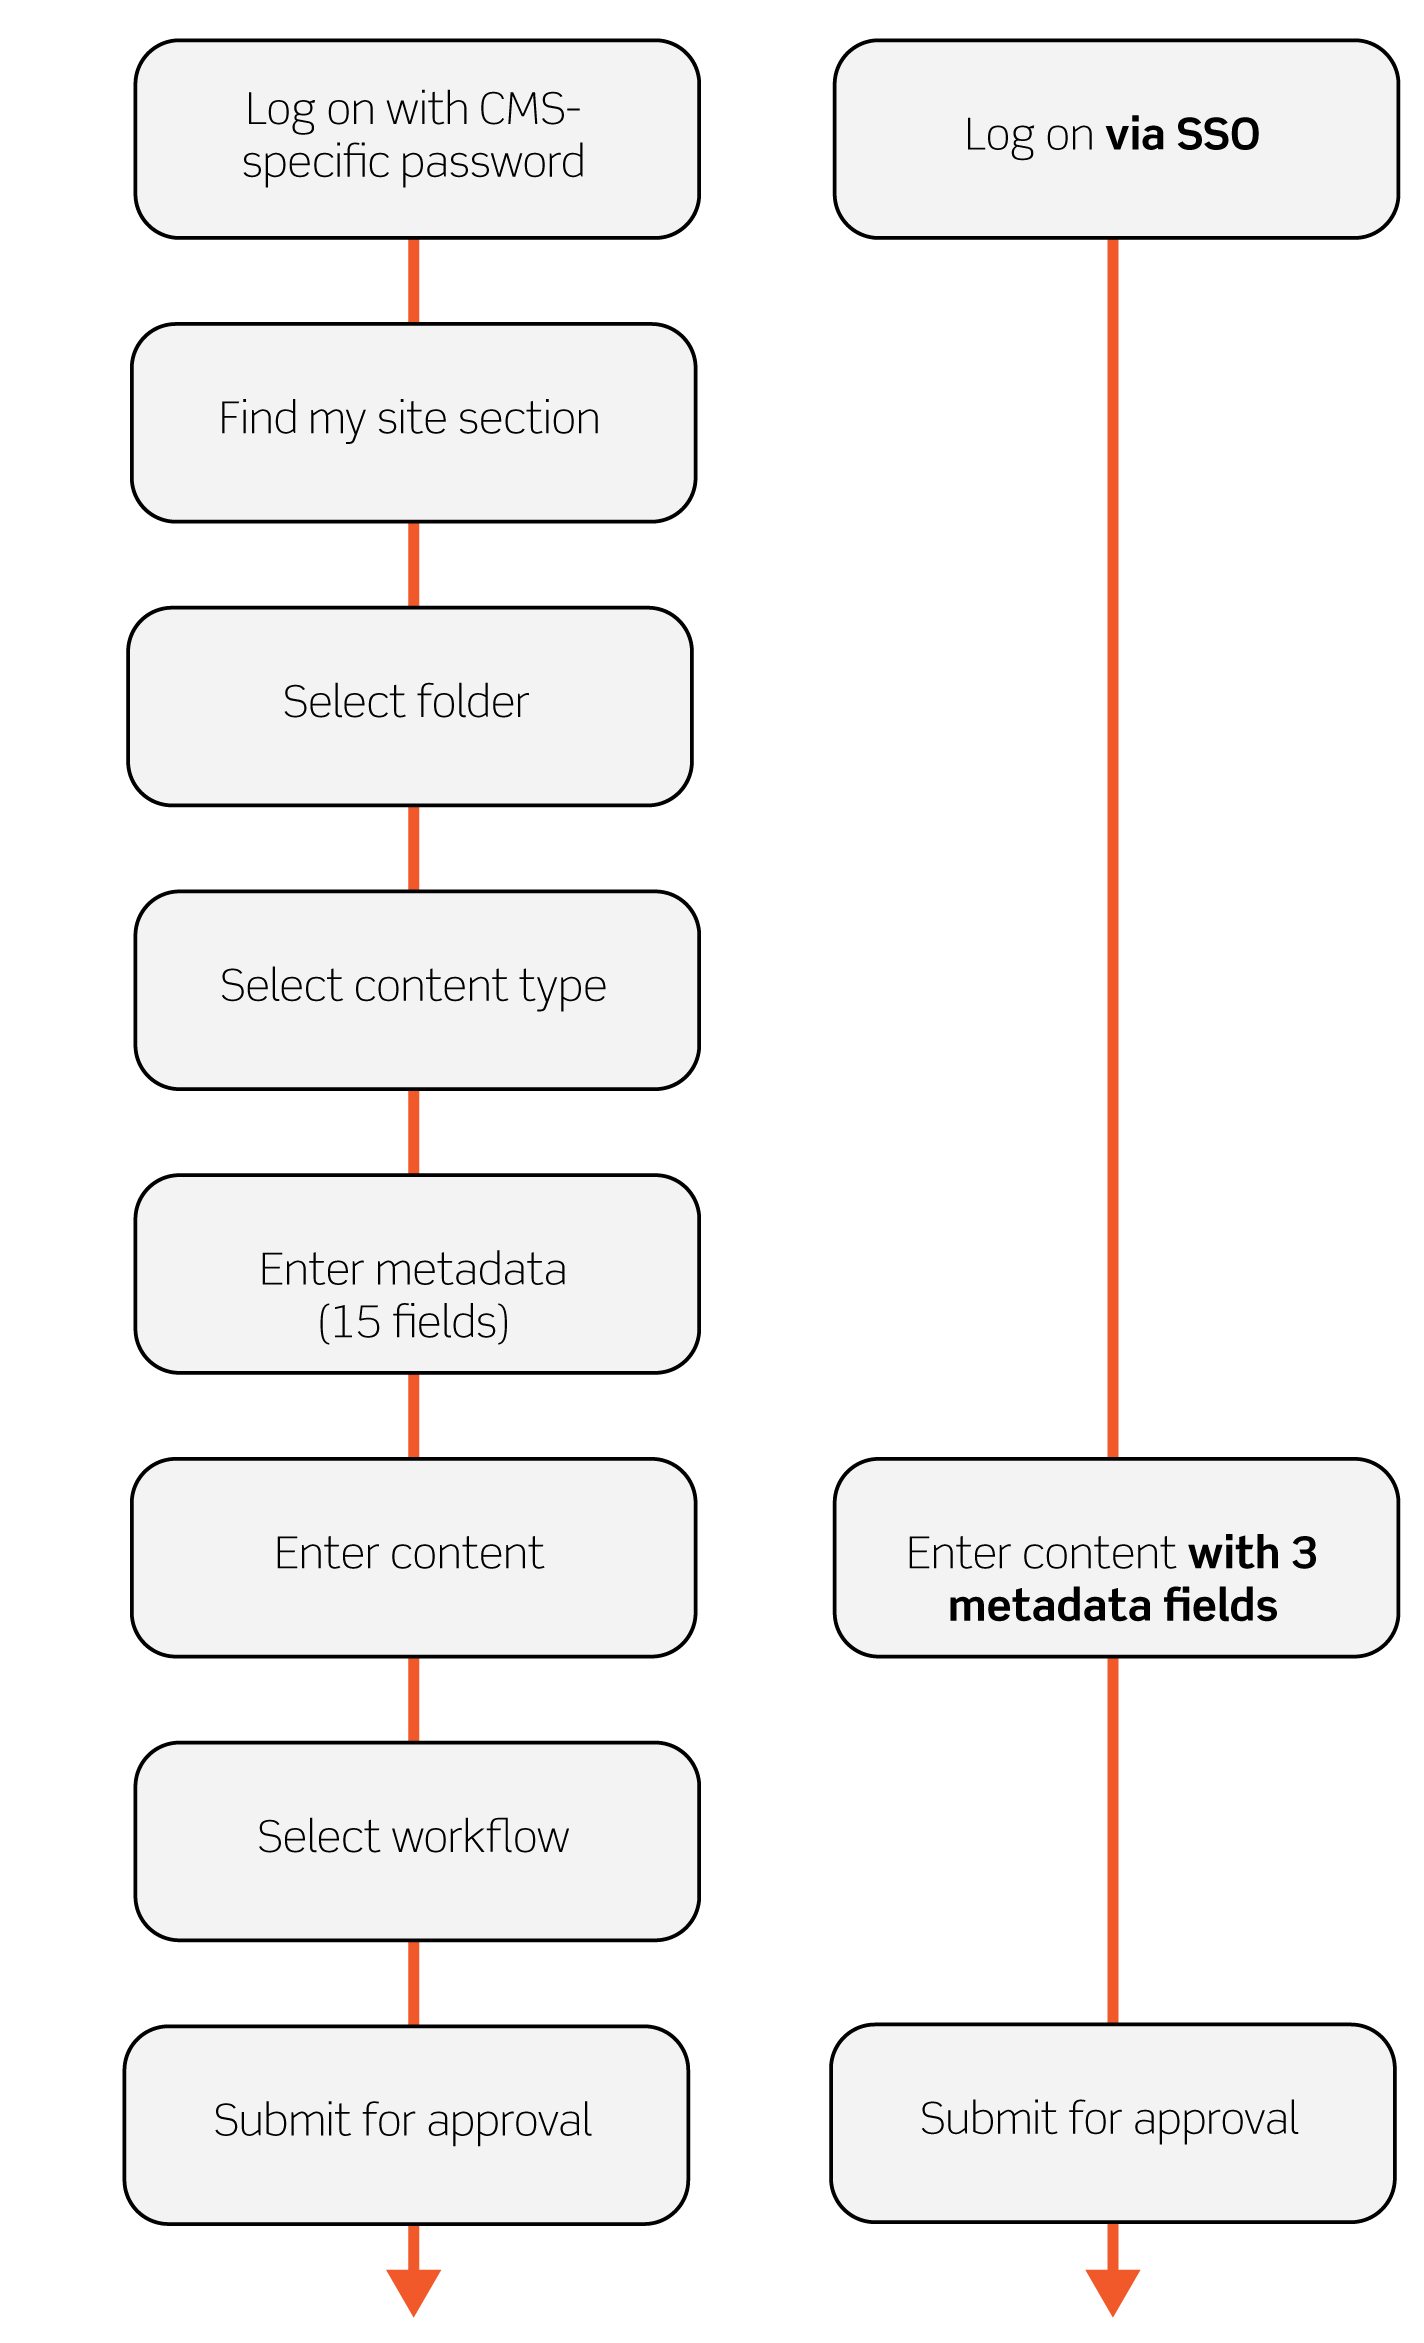
Note that, even if you go forward without making any changes other than distributing content entry to more people, you at least get people prepared and they understand the impact of the decision they are making.
Another way of making the content production impacts clear is simply to declare minimum reasonable standards and then see if everyone is prepared to meet them. For example, a common urge is to have more metadata-driven pages because they are so “easy” for a CMS to render. This can quickly result in junk and blank pages. So if you declare standards (like writing a description) then you force a useful discussion.
Ownership and control impacts
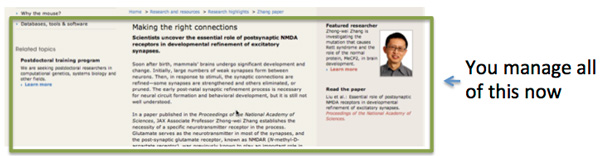
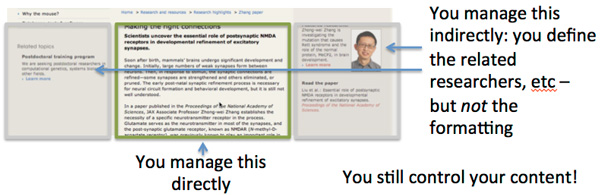
One of the most significant seemingly-small issues that can snowball into a major problem is one-offs, especially for large sites. (lots of links). One of the ways of controlling this is turning what may appear to be an either/or discussion (for instance, either the requester gets a complete one-off to control as they wish or they have to stay in a rigid template) into a more nuanced discussion. But at any rate, the issue of control and ownership of pages and content needs to be agreed upon at a high level, since these often need to change to make a big change. One way of doing this is simply to mark up a web page to highlight what parts of the page will currently be controlled by the page “owner” and what they will control in a more templates environment (the first image showing how the control happens now and the second showing how it could happen in the future):
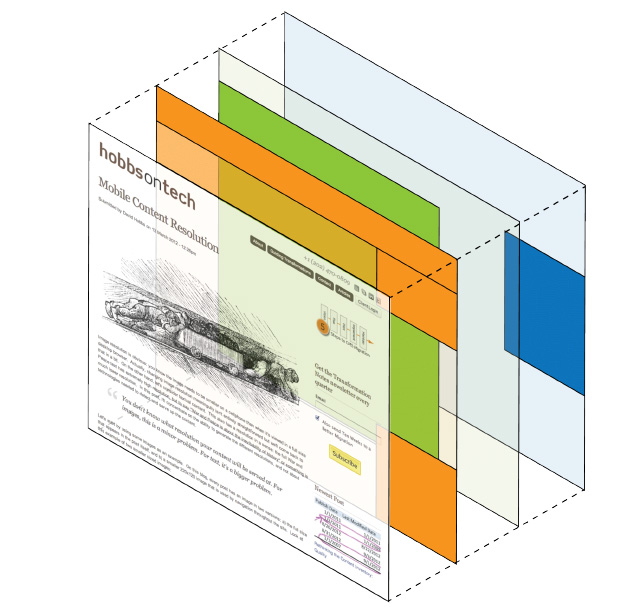
For a large web presence, you can also draw out the hierarchy of templating controls, either in a layered approach as below or in a typical 2-D tree view.
External impacts
Before starting the discussion of visualizing external impacts, note that higher fidelity prototypes or mockups are NOT the answer to visualizing external impacts. In fact these can lead to a false sense of security (“if I can draw it, then it must be implementable”).
Also, the exact method of demonstrating external impacts depends on what your are attempting to achieve, from a business perspective, on your web presence. So one of the keys here is being clear about your website vision, which concentrates on how it should perform from a business perspective. In addition to the static view of your site, you will need to illustrate the flows that site visitors experience (either within one visit or multiple visits).
I frequently work with organizations to better focus their sites, and the example methods of illustrating the impacts of proposed website changes are consistent with this general need to better focus sites.
Vision coherence: state and evaluate
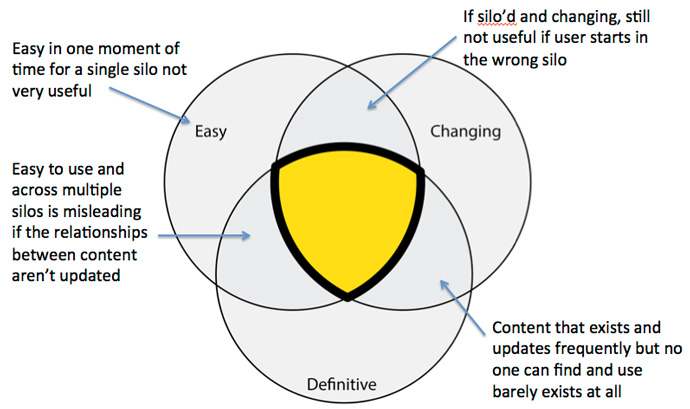
When making any big changes, you should have a clear statement, that everyone understands, of the goal you are shooting for. This vision should anchor the entire strategy evaluation process, but in specific the vision needs to be coherent. Teams may be tempted in the heat of change to jettison components of the vision so one technique is to visualize how each part of the vision is needed. For example, the anchors for one client of mine were that it was easy for visitors to find information, that the information constantly needed to change, and that the content was definitive in the field. Of course more definition and shared understanding was fleshed out, but at a high level consider this illustration that helped to paint the picture that all three were needed:
Trapped browse paths
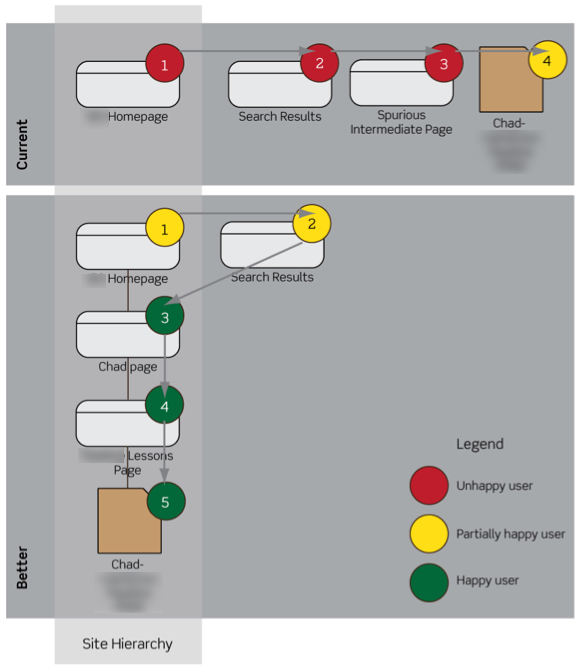
Content contributors usually have a heavy concentration on the artifact they are generating. For instance, if a team is writing a report then they are concentrating on that report. But out in “the wild” of your web presence (which can include venues outside your control of course), people may arrive at that report and not want that report. Or even if they want the information in the report, they may not even know it if the report struck them in the face (for instance if it was written for another audience). The point is that you don’t want to trap users. Most websites wind up trapping users. One way to illustrate this is to show browse paths now vs. how they could work, perhaps with a twist of a better hierarchy:
You can also take screenshots along the path with arrows between them. For example, if your primary navigation changes across your website, you can clearly show “you can’t get there from here” examples if a site visitor happens to land in one silo vs. another.
As mentioned above, illustrating the external impact really depends on your business, but in general make sure to be demonstrating the impact on how your proposed changes will impact your business goals, which frequently also center around making sure the implementation is coherent as well as focused. Other techniques can involve search engine ranking against central concepts to your business (here I am not talking about tricky SEO but rather how well you are known for key terms in your field) and tables comparing advantages and disadvantages of possible approaches.
Scope and prevalence
What’s your number?
This may perhaps be the most difficult for organizations to face: your “web team” may just be looking at a tiny (and perhaps insignificant) part of your web presence. So the first thing I would do to help address this is fairly simple:
Ballpark, how many pages are there now in the web pages that your organization directly controls (across all systems, teams, geographies, etc)?
When you are discussing your strategy, what percentage of those existing pages are you talking about? (or similarly, what percentage of those pages is the “web team” responsible for?)
Before beating your chest about how big the changes you’re making are, look carefully at the percentage of pages that you are talking about. Make sure that you aren’t just creating another one-off.
Site coherence
Related, look for ways to illustrate how fractured your site is. If you have multiple sites (or you could use the same technique for sections of one site), then you could illustrate what percentage of the sites are standardized like in this example:
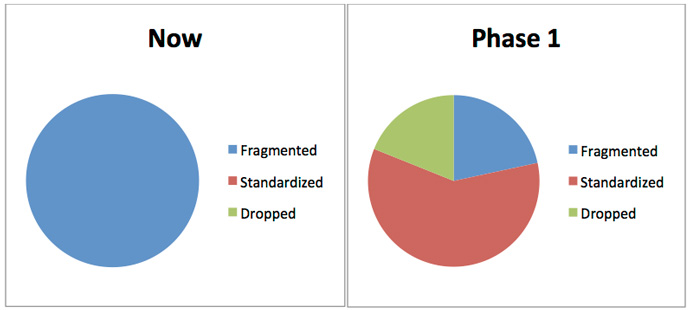
Coherence has many different flavors, but the general idea is to summarize the situation (and desired state) in a way that drives discussion. In the above example, this naturally spawns questions such as: “Why have any fractured sites? Can we drop more sites? Can we really standardize this much?”
Visualizing early and often
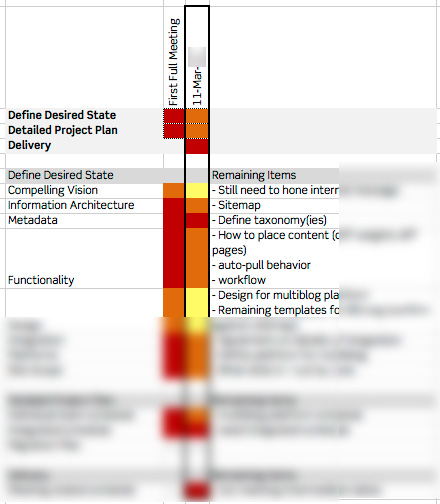
I frequently write about needing to plan early, and way before developing an RFP. Illustrating the impacts of changes should be part of this early planning, to make sure that everyone is on board before getting too far down the path of implementation. That said, visualizing during the implementation is also key, especially when implementation starts. For example, below is the progress report for an example project one week into implementation, where it was clear as an outside consultant that the project was not on track for success:
Everyone needs to think about the impacts
The major theme in Website Product Management is that everyone needs to look at their website as a product (business first, thinking broadly and long term). In the case of illustrating the impacts of ongoing changes, the primary burden falls on the core team but should also be used by anyone that feels that the direction the team is taking won’t work. In the case of a strategy development, relevant stakeholders should be clear about the impacts before agreement, so the team developing that development (whether internal and / or external) should attempt to ensure buy-in.
Summary, and taking it from here
This article lists a smattering of possible ways of illustrating the impacts of changes, and hopefully one or more of these visualizations will be useful as you consider making big changes. Fundamentally, make sure to always break down the situation for stakeholders when defining your direction forward on your website, either for big changes or for the ongoing trickle of changes.